Analysis
When designing the bridge there were various requirements that needed to be accounted for as well as tests that the bridge would need to complete to pass. These determined the size, dimension, and weight of the bridge, as well as the articulation structure. There were 12 points of analysis that were done in the project, including determining the compressive and tension forces acting on the bridge, the minimum cross sectional area of the beams to withstand these forces, forces acting on the cable that would pull the bridge up and how this will cause the articulation structure to react, dimensions for the articulation structure, and specifications for the motor. Analyzing these aspects of the bridge will ensure success in testing.

Figure 1: Initial Sketch
Analysis 1: Method of Joints

Figure 2.1: Reaction Forces
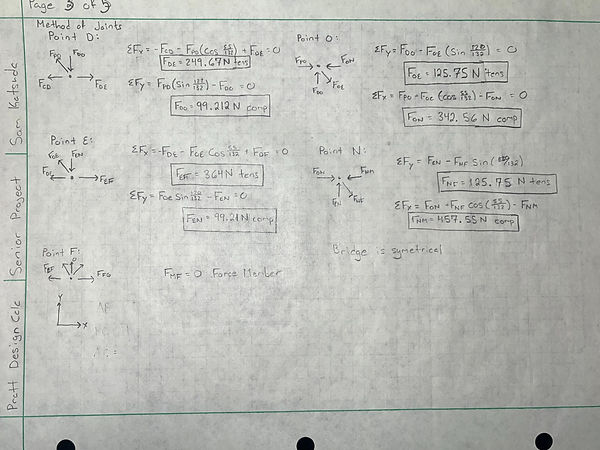
Figure 2.2: Method of Joints
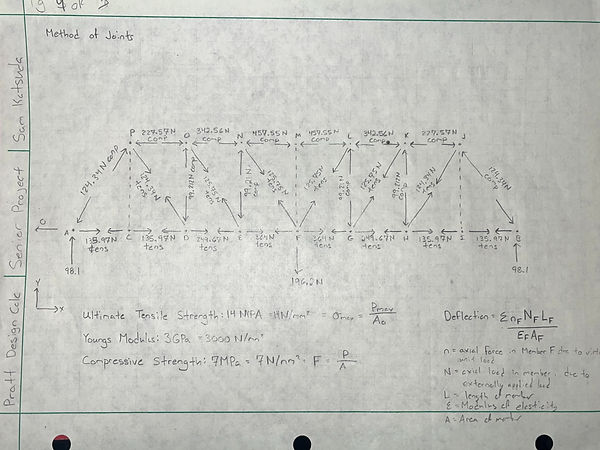
Figure 2.3: Diagram of Forces
The aim of this analysis was to determine the compressive and tension forces in each member of the truss. This would be used to find the max tension and compressive force to be used to determine the minimum area the beams would need to be to support the 20kg weight. To begin, the sum of moments and the sum of forces was used to find the reaction forces at either end of the bridge. This assumes the bridge is static (Figure 2.1). After the reaction forces were found, the method of joints could be used to determine the compressive and tension forces acting on the beams (Figure 2.2). The result is the diagram in figure 2.3 which depicts the forces acting on each member of the bridge.
Analysis 2: Volume and Mass of Bridge

Figure 3: Dimensions and Weight
Figure 3 depicts the calculations done to solve for the cross-sectional area of the beams and the weight of the bridge structure. The cross-sectional area was found using the stress equation as the max stress of balsa wood was given, and the force acting on the beam was calculated in analysis 1. The result is the cross-sectional area. The dimensions for the beam,s was solved for with the thickness being set to a standard measurement of balsa wood. Then the other dimension could be solved by giving the dimensions for the minimum area for the beams. It was found that the minimum dimensions for the beams in tension was 2.047mm x 6.35mm, and the minimum dimension for the beams in compression was 5.147mm x 6.35mm.
The weight was solved by using a density. The length of the beams was calculated and then were able to be multiplied by the cross-sectional area to solve for the minimum volume of the bridge. Then using the density of balsa wood and the volume of the bridge, the weight could be calculated to ensure that it was below the maximum weight standard. It was determined that the bridge using the minimum dimensions would weight 16.64 g which is below the 85g weight constraint.
Analysis 3: Force and Minimum Dimensions of Side

Figure 4.1: Side Force Calcs Part 1

Figure 4.2: Side Force Calcs Part 2
Calculations were performed to determine the forces acting on the side of the bridge. Similar to analysis 1, it was assumed that the bridge was static and the reaction forces were calculated to determine how much force was acting on the cross beams of the bridge. This was done using the sum of forces and the sum of moments with the bridge at equilibrium. It was found that the cross beams were under 37.392 N of compressive force on the top beams, and 37.392N of tension force on the bottom beams.
Analysis 4: Articulation Cable Position

Figure 5.1: Articulation Cable Position Part 1

Figure 5.2: Articulation Cable Position Part 2
The purpose of this analysis was to determine which mounting location would be most effective for the cable mounting location. Based on these two calculations, it was determined it would be most effective to mount the cable to the top middle of the bridge, as it would still be under a small amount of force and would allow for a shorter and smaller form articulation structure which saves weight in the end. It was found that the final force acting on the cable is 2.022N which is not much greater than the force when attached to the end being 1.519N. This was performed using basic geometry as well as the sum of forces.
Analysis 5: Articulation Forces

Figure 6.1: Articulation Forces Part 1
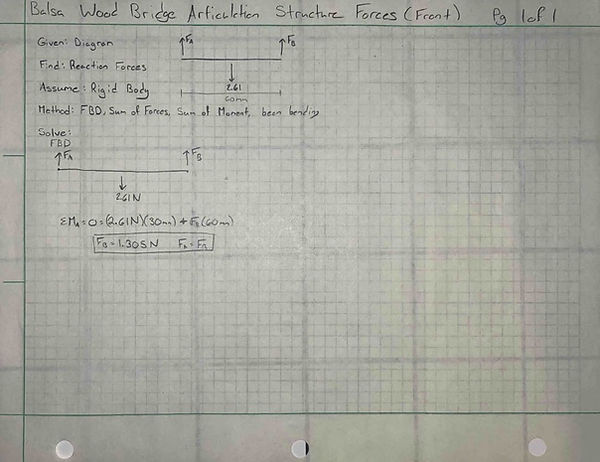
Figure 6.3: Articulation Forces Part 3

Figure 6.2: Articulation Forces Part 2

Figure 6.4: Articulation Forces Part 4
This analysis was used to determine the forces acting on the beams of the bridge. This was accomplished using truss analysis as well as the sum of moments and the sum of forces.Using the final diagram depicting the forces acting on each of the truss members, they could be used to determine the minimum cross sectional area the beams would need to be to support the load.
Analysis 6: Articulation Cross Sectional Area and Weight
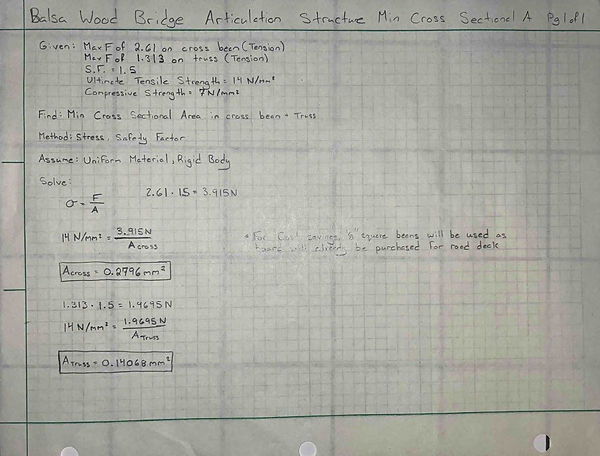
Figure 7.1: Cross Sectional Area Calc

Figure 7.2: Weight Calc
Using the forces calculated in analysis 5, the cross-sectional area of the beams of the bridge could be found. This was done using the stress equation, with the force being a known variable as well as the stress. This allowed for the area to be solved for and was found to be 0.2796mm^2. As this is not a standard size, it was determined a 3.125 x 3.125 mm^2 beam would be used as it would already be in the purchased material list for the road deck. then using this newfound cross-sectional area, the volume could be determined and the weight could be found using the density equation. It was found that the final weight of the structure was 1.4g.
Analysis 7: Joint Analysis

Figure 8: Joint Analysis
Calculations needed to be preformed to determine the best choice for how to connect the joints of the bridge. The choices were pins on the bridge or wood glue. Was was determined was that due to the much higher strength and ease of manufacturing, glue would be the main joict connection method used.
Analysis 8: Motor Power

Figure 9.1: Motor Power Part 1
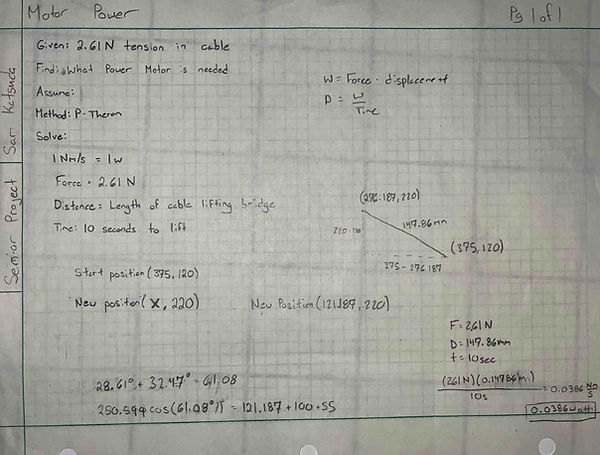
Figure 9.2: Motor Power Part 2

The power necessary to lift the bridge needed to be calculated. This was accomplished using the power formula power = work/time, with work being force/distance. The force used was the tension force on the cable, the distance used was the length of the cable being reeled in, and the time used was 10 seconds to provide a buffer of a factor of 2 in the total time for articulation. It was determined that the power needed to lift the bridge would be 0.0386 watts. This could then be compared to the max power output of the motor projected to be used to ensure it could lift the bridge. This was done using the power equation Power = voltage * current, with the voltage and current being the max depicted on the Figure 9.1 manufacture specification sheet. It was determined it was capable of a max of 15.6 watts which is easily enough to lift the bridge.
Figure 9.3: Motor Power Part 3
Analysis 9: Motor Mount
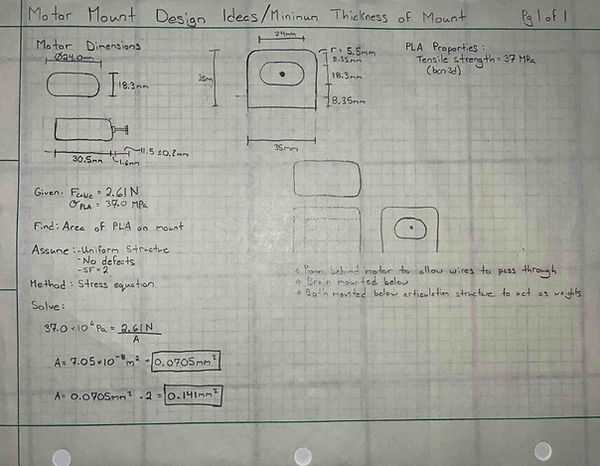
Figure 10: Motor Mount Calcs
For the bridge to successfully articulate the structure, it needs to be able to be stable and secure. For this to work, the stress equation was used to determine the cross-sectional area of the motor mount in oder for the tension force caused by the cable to not rip the motor off the mount. Using the force of the cable, and the max stress of PLA, the area could be calculated. It was found that the minimum cross sectional area would need to be 0.0705 mm^2 for the motor no not be ripped off. This was given a safety factor of 2 to ensure a secure and sturdy mount, which resulted in a cross sectional area of 0.141 mm^2.
Analysis 10: Spool Dimensions

Figure 11: Spool Dimensions
As the spool needs to be able to seat enough cable to fully articulate the bridge as well as be the propor size to sit on the motor and clear the motor mounting system. This was done using basic geomety. The final dimensions of the reel can be seen above in figure 11.
Analysis 11: Weight to Prevent Tipping
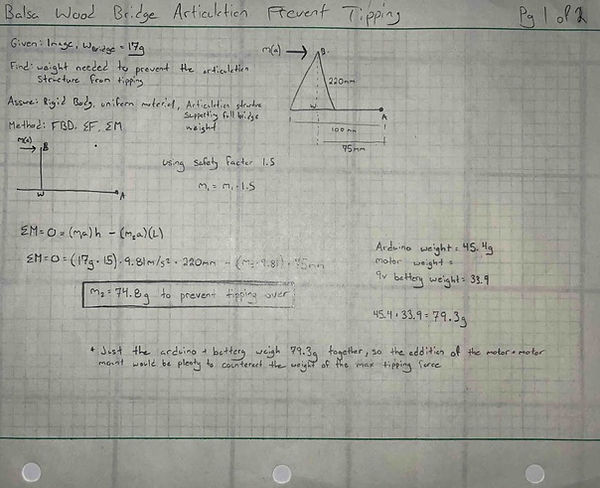
Figure 12.1: Tipping Prevention Calc Part 1
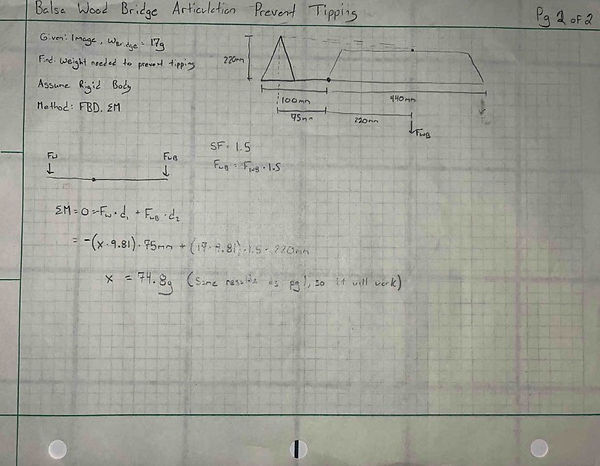
Figure 12.2: Tipping Prevention Calc Part 2
To calculate the weight needed to counteract tipping, the sum of moments was used. The weight of the bridge would cause the articulation structure to tip forward, so to counteract, there needs to be a certain weight on the system. With the system in static equilibrium, it was found that the weight on the articulation system would need to be 74.8g to prevent tipping.
Analysis 12: Verticle Deflection

Figure 13.1: Verticle Deflection Part 1

Figure 13.2: Points used(mm)

Figure 13.3: Trusses Created

Figure 13.4: Bridge Support Locations

Figure 13.5: Material Proporties

Figure 13.6: Loads on Truss (N)
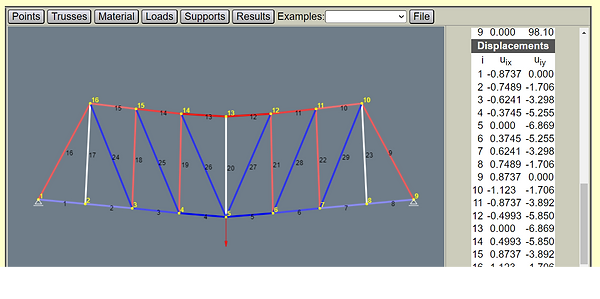
Figure 13.7: Final Vertical Deflection Table (mm)
A requirement of the bridge was that it needed to deflect less than 25mm vertically. As the dimensions and materials used on the bridge are known, they can be plugged into an online calculator to determine the max deflection. This was done using Jade Hochschule. It essentially found the total forces acting on the members of the bridge, and using the material properties, determined the max flex, which was found to be 6.869mm which is less than 25mm.
Analysis 13: Cycle Time

Figure 14.1: Cycle Time Calculations
A requirement of the bridge was that it needed to be able to achieve a full cycle with a 10-second pause in under 60 seconds. Using the diameter of the bridge, the circumference of the reel could be found, and using the given RPM of the motor, the length of the cable being displaced, and the found circumference unit cancelation could be done to determine the cycle time. This was done for the speed up, the speed down, and then added to the 10-second pause. It was determined the bridge would be able to complete the full cycle in under 60 seconds to pass the requirement.